Skip to content

Market Statistics

Be the expert!

As a member benefit, the Prescott Area Association of REALTORS® provides monthly statistics to keep members informed of the latest market conditions. Our comprehensive collection of data, including shareable social media graphics, news release and customizable charts allows you to be the expert source of information for your clients.

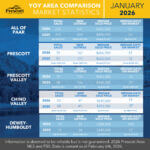
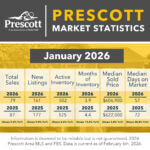
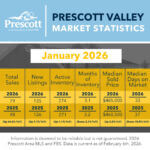
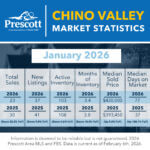
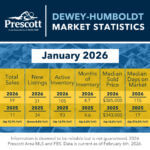
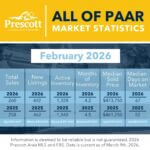
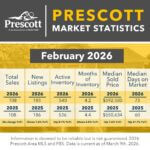
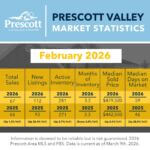
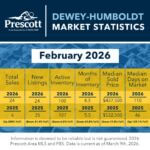
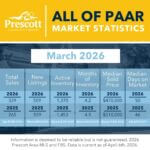
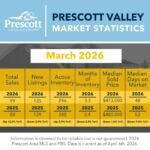
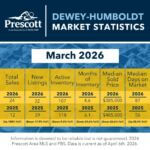
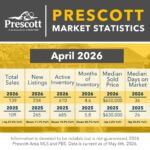
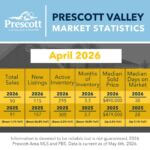
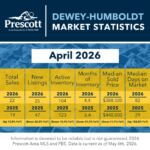
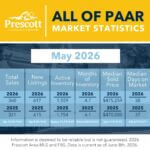
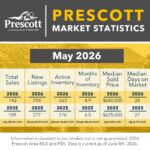
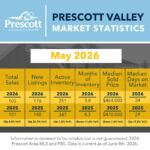
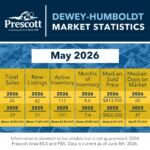
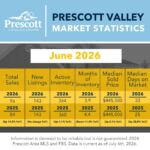
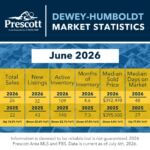
Shareable Social Media Graphics

Download and share the monthly market statistics graphics. (Note: Statistics are pulled the first week of each month for the previous month.)

Monthly Press Release

Read the monthly market news release to gain an overview of the latest trends in our local market.

See our full publication in PrescottNOW magazine or online at SignalsAZ.

Media Inquiries: Contact Ali Gosselin at alison@paar.org.

Market Statistics Videos

Check out the latest market conditions in this shareable monthly video.

Customizable Market Report

Whether it’s Prescott, Prescott Valley, or more, you can select an area of interest, type of property, and a given month going all the way back to 2016! Feel free to generate the report you want, print it, or share it with your clients!

Here's how to use it:

  • Select which month you'd like to view at the top (click the down arrow to see all available months)
  • Select the dropdown for Property Type (top left) and choose any or all to include
  • Select the dropdown for the areas (top middle) and choose any or all to include
  • Toggle the switch below the areas dropdown to compare to the prior year or to the prior month
  • Watch the data in the chart update!

Share the report on your social media, newsletter and website:

  • On the bottom right corner of the chart, click the Print icon
  • Print out the chart or save as a PDF to share it

Market Analytics Tool

Compare month-over-month changes with the market analytics tool! Select your date ranges, areas, and property/listing types to generate results for a variety of analytics.

Here's how to use it:

  • Select the dropdown in the top right for the month you'd like to view
  • Select the dropdown for Property Type in the top left and select your preferred types to search
  • Select the dropdown for areas in the top middle and select your preferred areas to search
  • Toggle the switch at the top right to view data from the past 13 months or year-to-date
  • Watch the data in the chart update!

Share the report on your social media, newsletter and website:

  • On the bottom right corner of the chart, click the Print icon
  • Print out the chart or save as a PDF to share it